App View
The Application Details section can be accessed by clicking on your application's name. It contains several metrics describing transaction performance for this specific application.

Cards
| Chart | Description |
|---|---|
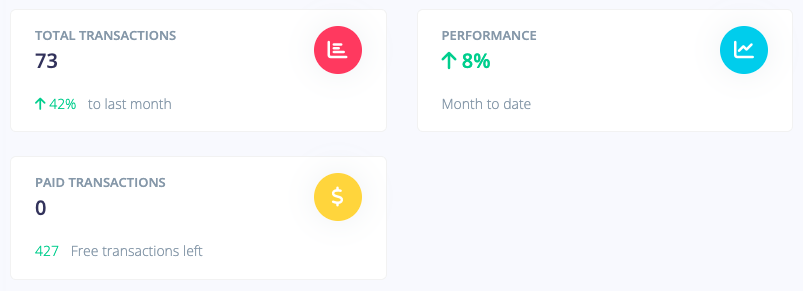
TOTAL TRANSACTIONS | Total amount of successful transactions this month. Compared with last month. |
PAID TRANSACTIONS | The absolute number of free transaction quota left, with the number of paid transactions going above that limit. |
PERFORMANCE | The application's transaction progression based on current month to date. Compared with last month. Example: If your application reaches last month's transaction count in half the time, this metric will show +100%. |
Graphs
| Chart | Description |
|---|---|
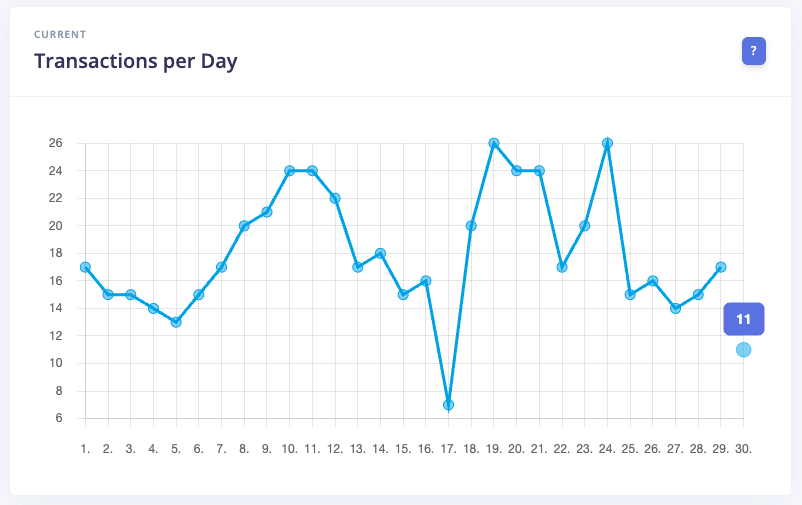
Transactions per Day | Graph showing your current transaction amount on a day per day basis in this month. |
| Chart | Description |
|---|---|
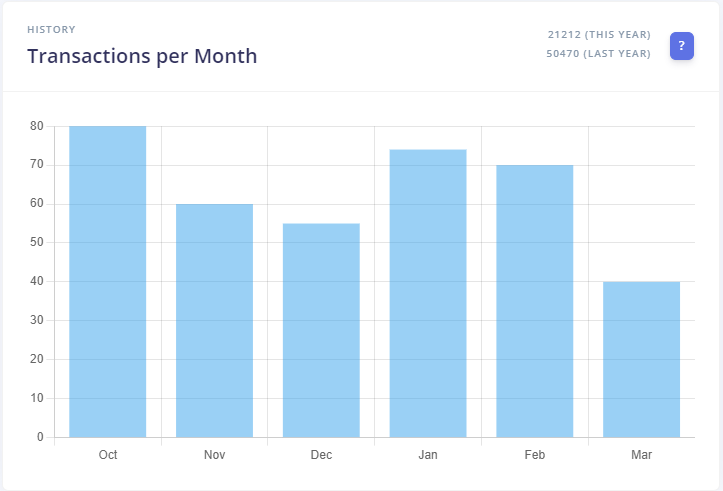
Transactions per Month | Graph showing your past total transaction amount on a month to month basis. |
Tables
| Chart | Description |
|---|---|
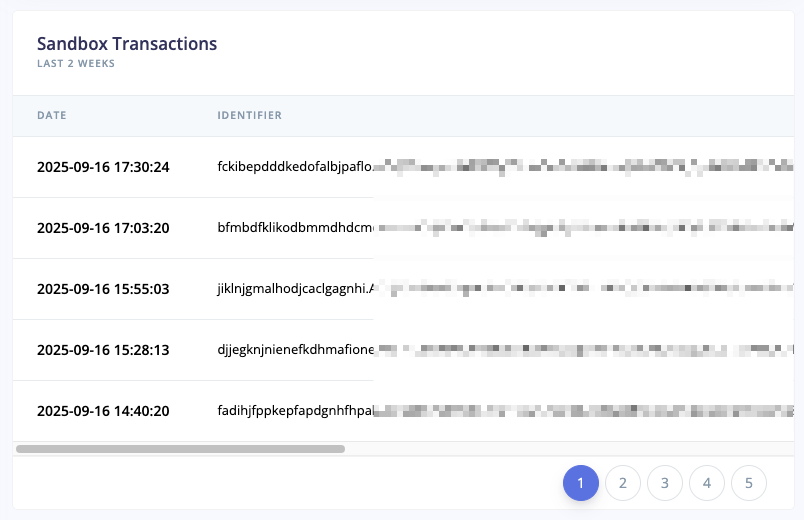
Sandbox Transactions | List of successful transactions that are originating from a sandbox environment. Up to 100 transactions within the last 2 weeks are shown. |
| Chart | Description |
|---|---|
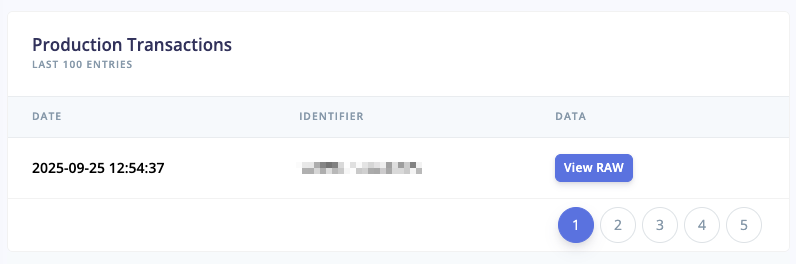
Production Transactions | List of successful production transactions. The most recent 100 transactions are shown. |