Overview
The Dashboard section is the first page you see after logging in. It contains several metrics describing combined transaction efforts across applications on your account.
Cards
| Chart | Description |
|---|---|
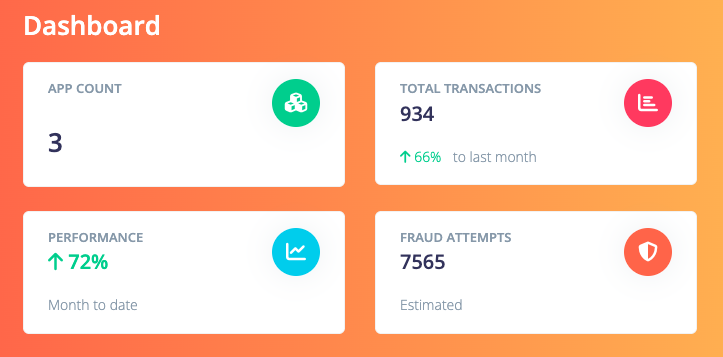
APP COUNT | The number of applications created on your account and taken into consideration for the following statistics. |
TOTAL TRANSACTIONS | Total amount of successful transactions this month. Compared with last month. |
PERFORMANCE | Transaction progression based on current month to date. Compared with last month. Example: If you reach last month's transaction count in half the time, this metric will show +100%. |
FRAUD ATTEMPTS | Estimated amount of prevented fraud attempts based on a calculated fraud ratio using all fraudulent requests on the platform. |
Graphs
| Chart | Description |
|---|---|
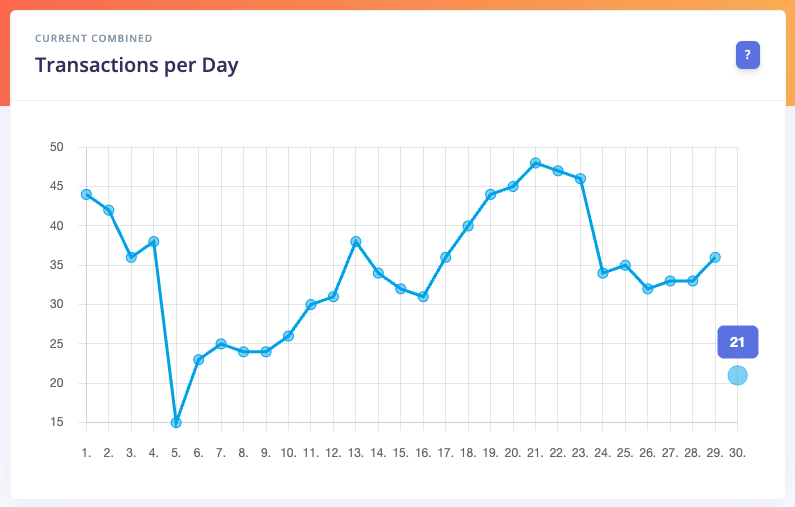
Transactions per Day | Your current transactions across all apps on a day per day basis in this month. |
| Chart | Description |
|---|---|
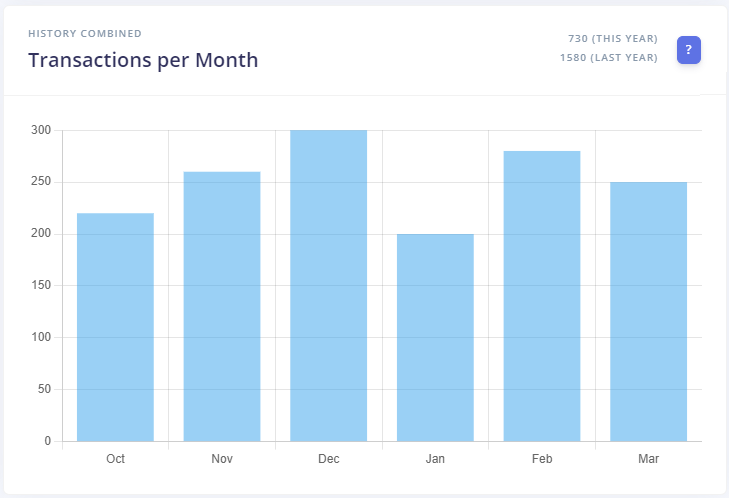
Transactions per Month | Your past transactions across all apps on a month to month basis. |
Tables
| Chart | Description |
|---|---|
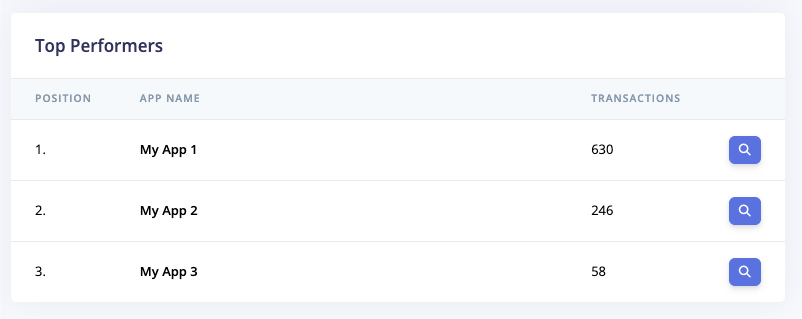
Top Performers | List of top 5 apps on your account, sorted by total transactions within the current month. |