App Analytics
These charts sit on the application page, below the ones described in App View. On the FREE plan the cards do not show any data.
Analytics describe the requests your application received, not the users who sent them. No personal data is collected. All charts cover the last 30 days and are updated once per hour.
Transactions per platform and per product
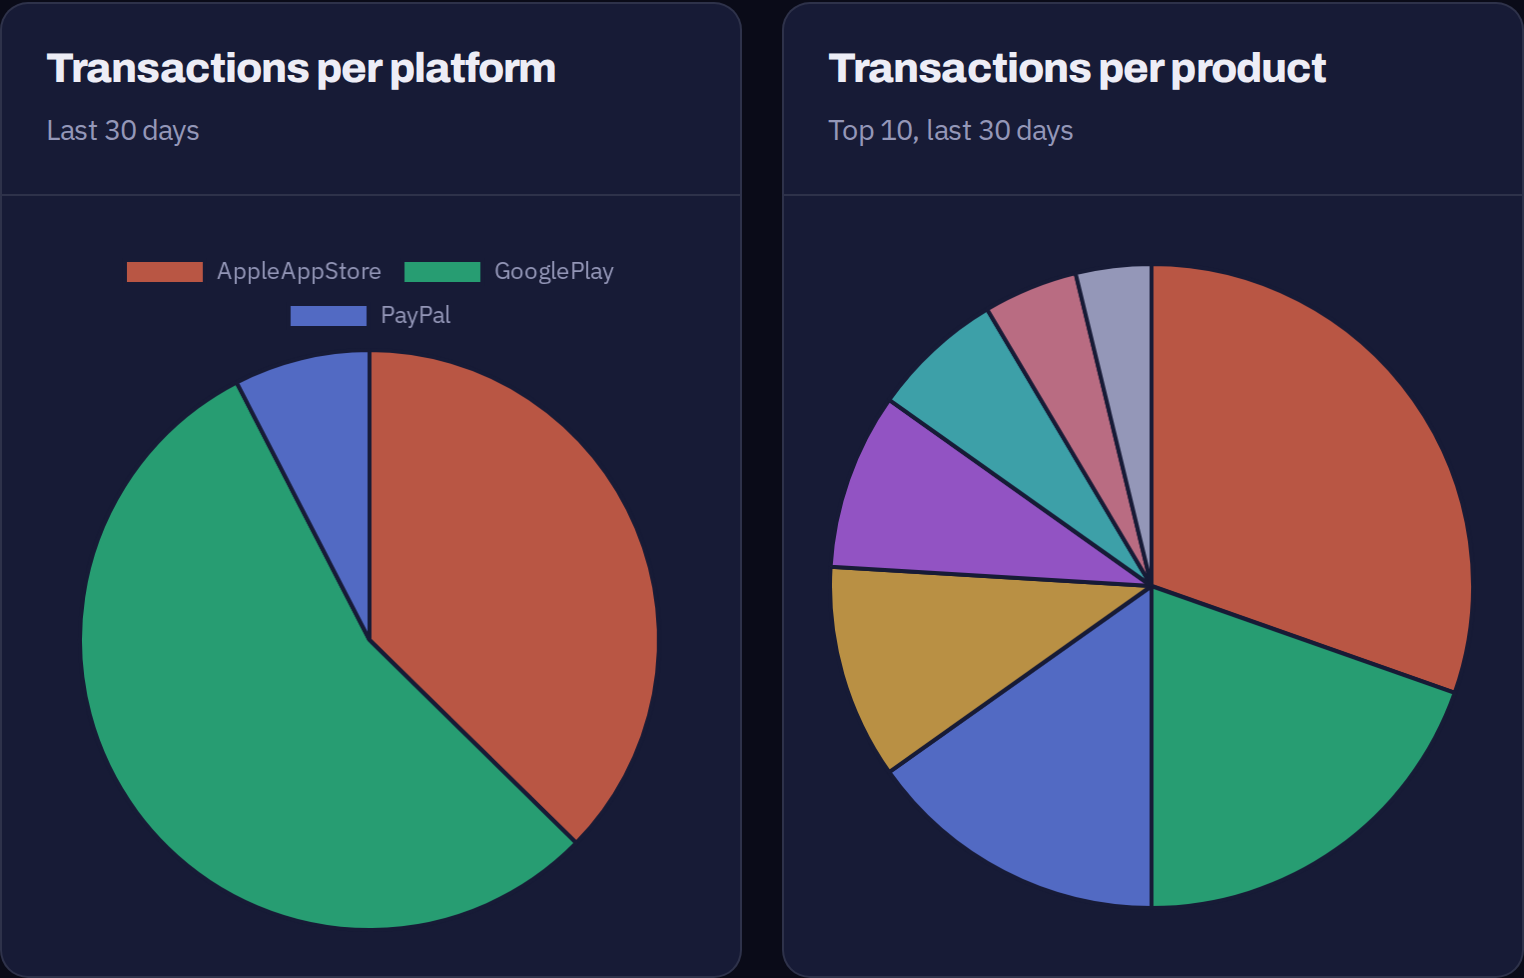
| Chart | What it shows |
|---|---|
Transactions per platform | How your purchases are split between the stores you have set up. |
Transactions per product | How your purchases are split between your in-app products. Only the ten largest are listed; everything else is grouped into Others. |
Transactions per country
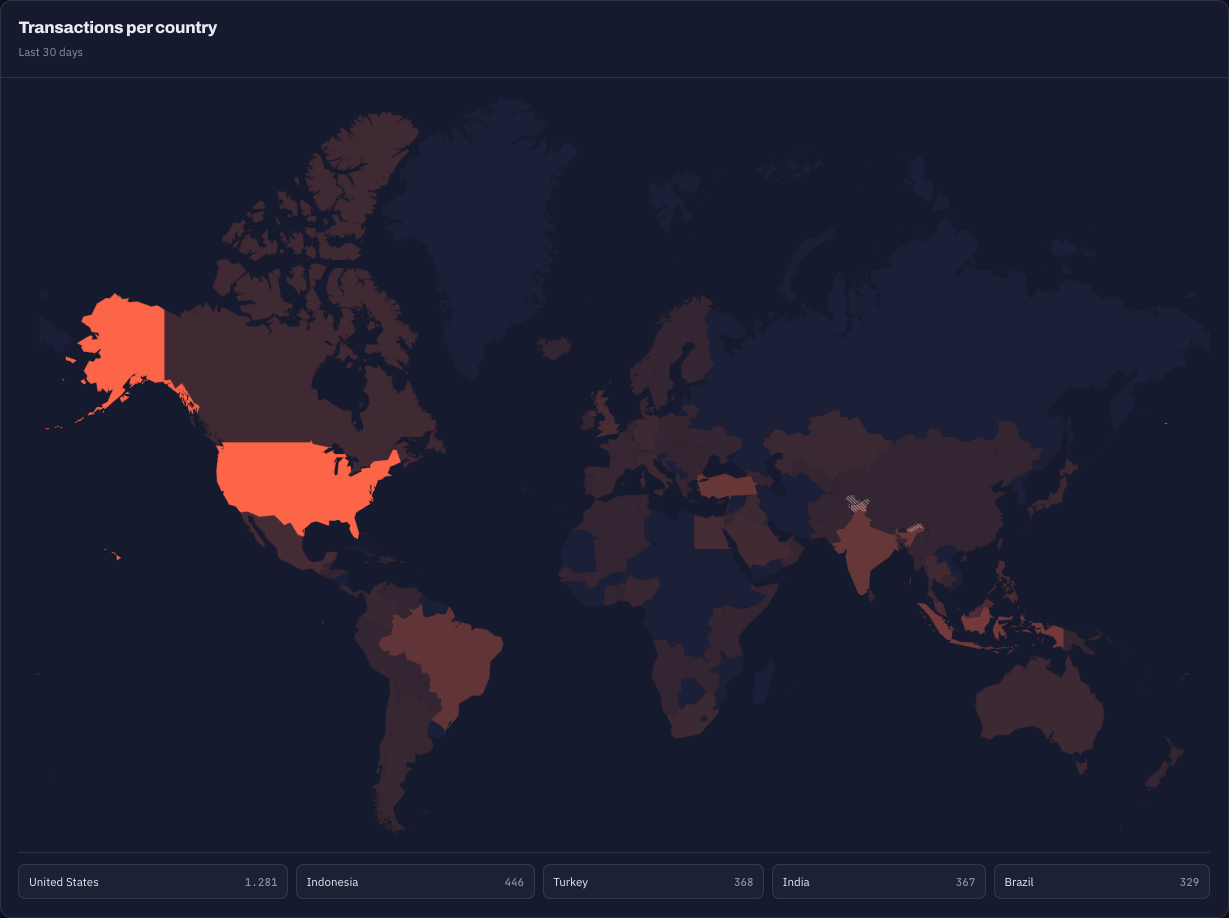
Each country is shaded by how many transactions came from it, with the exact count on hover. Countries with no transactions stay grey. The five highest are listed below the map.
Fraud Attempts by Type
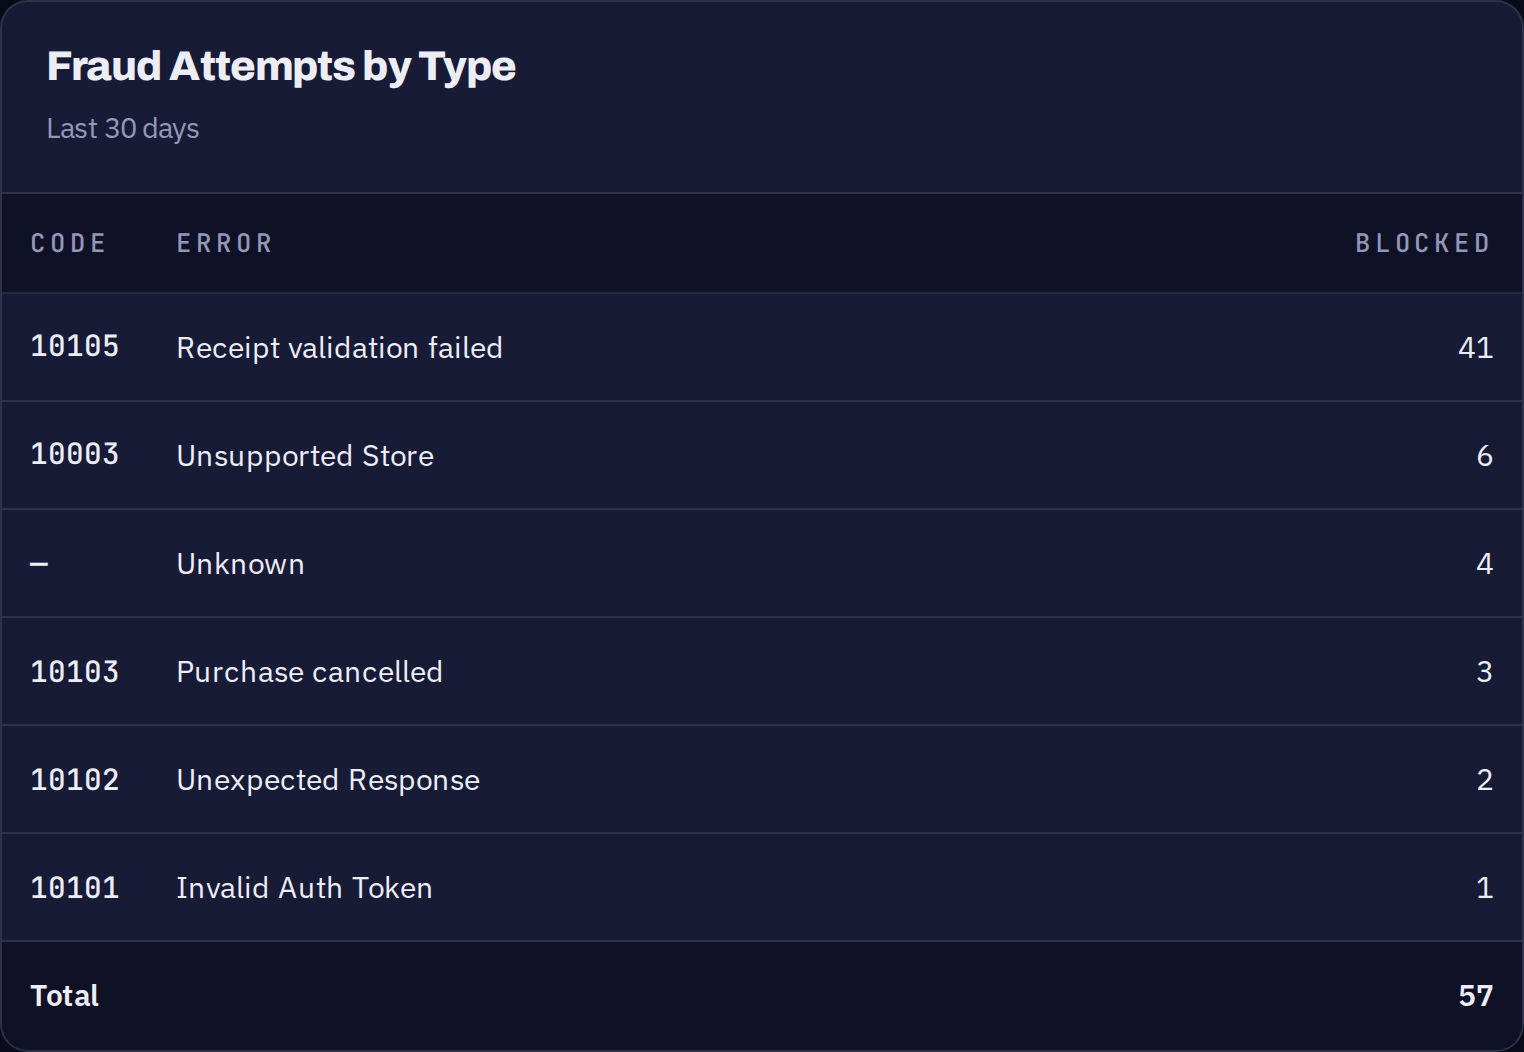
Every validation request that was rejected, grouped by reason. This is the detail behind the FRAUD ATTEMPTS tile at the top of the page.
| Column | What it shows |
|---|---|
CODE | The error code returned to your app. A dash means the request failed before a code could be assigned. |
ERROR | What the code means. The full list is in Error Codes. |
BLOCKED | How many requests were rejected for that reason. |
Not every entry is an attack. A cancelled purchase or a payment that did not go through is rejected the same way as a forged receipt, so read the codes before drawing conclusions.
User Storage API calls per day
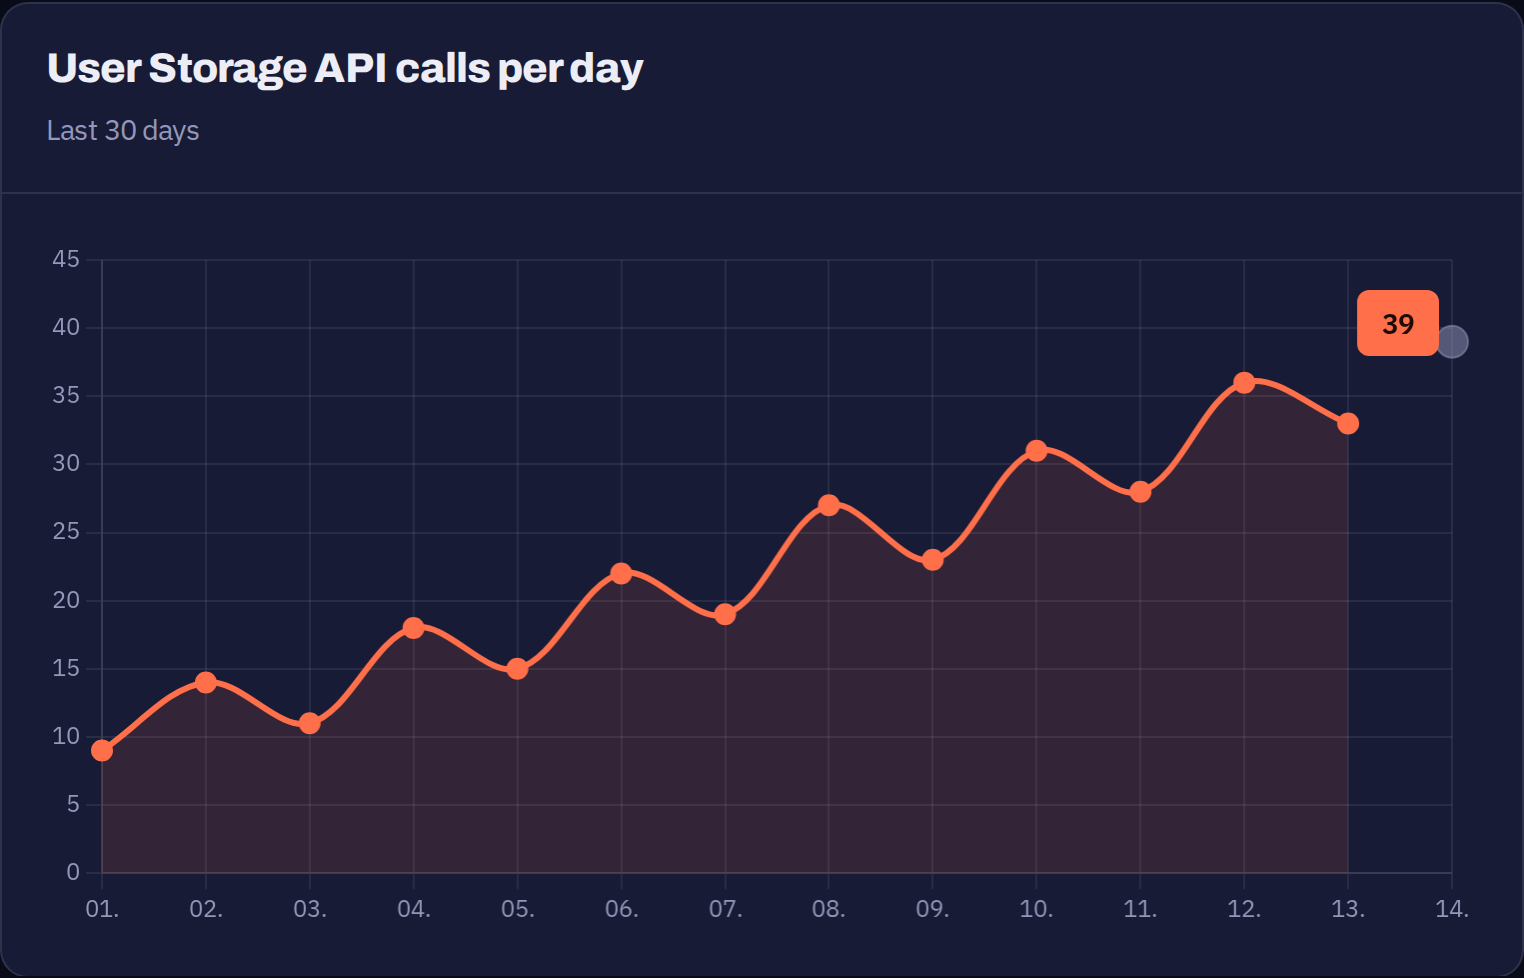
Incoming Get User calls per day. This only fills up when User Storage is switched on.
If you use our SDKs, this should only count users who own something, because users without an inventory never call the endpoint. A number far above your buyer count usually means the client is asking more often than it needs to.