App Analytics
info
Extended App Analytics can be requested on a CUSTOM plan.
The detailed App Analytics section can be accessed by navigating to Apps > App Options > Analytics. The displayed data consists of anonymous information collected from the requests for this specific app. All graphs display data for the past 30 days and are updated every 15 minutes.
Cards
| Chart | Description |
|---|---|
FRAUD ATTEMPTS | Total amount of failed transactions, which could be either caused by payment issues or fake receipts. |
Graphs

| Chart | Description |
|---|---|
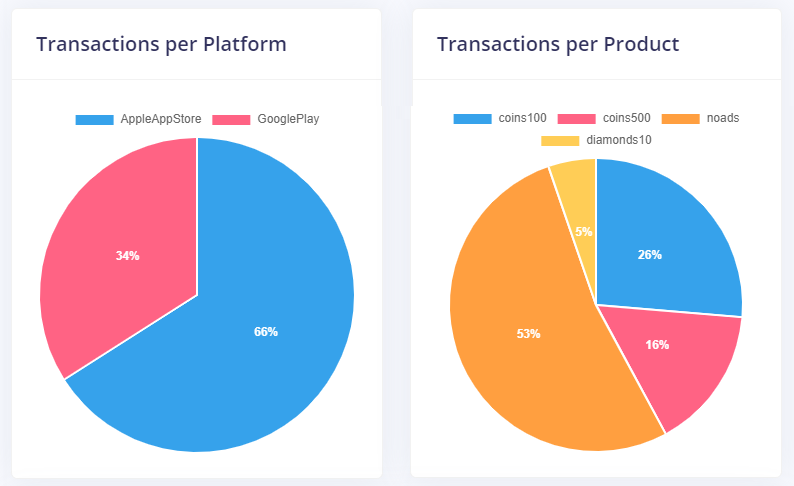
Transactions per Platform | Pie Chart showing the distribution of your recent transactions across App Stores. |
Transactions per Product | Pie Chart showing the distribution of your recent transactions across in-app products offered. |

| Chart | Description |
|---|---|
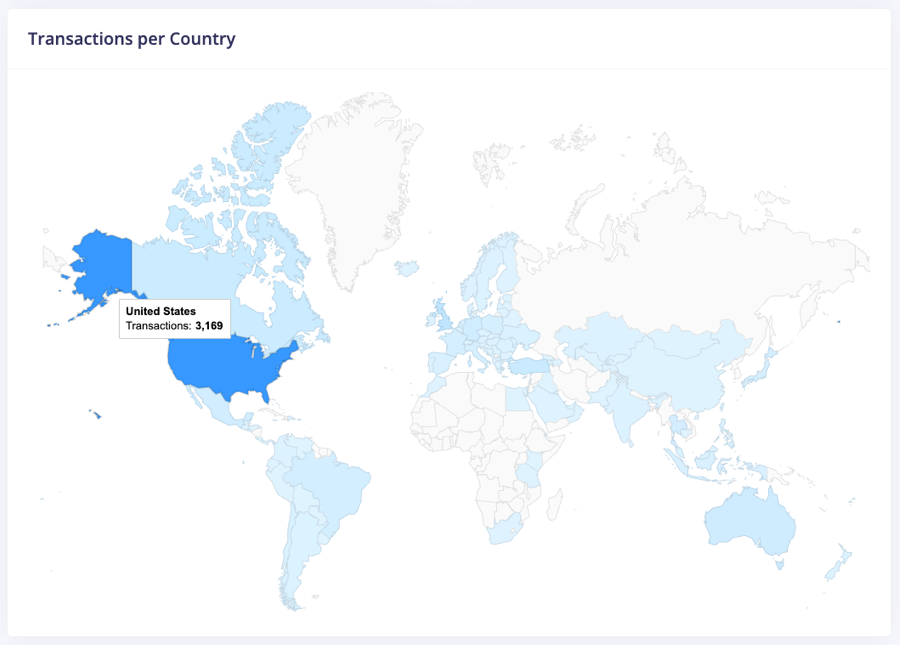
Transactions per Country | World Map highlighting countries with a colored indicator going from most to least transaction counts. The default color (no transactions) is gray. Exact transaction count can be seen on hover. |

| Chart | Description |
|---|---|
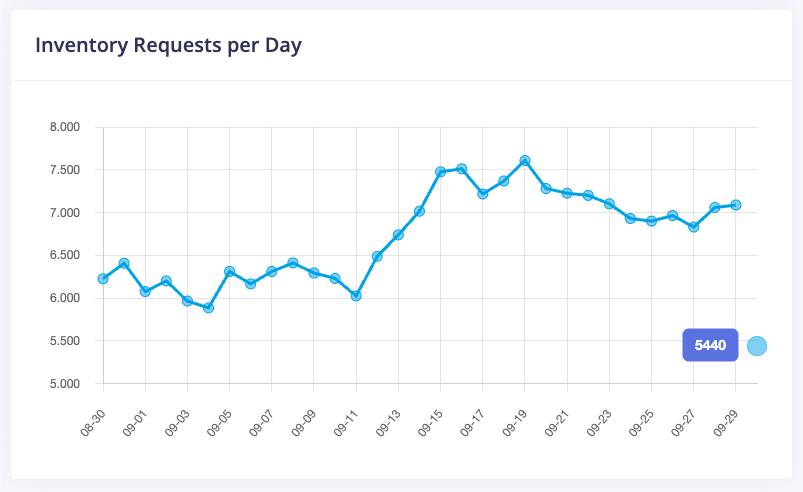
Inventory Requests per Day | Graph showing the incoming GetUser calls per day, if User Behaviour was enabled. If you are using our IAPGUARD SDKs, this should only display requests from users with an inventory (buyers), since non-buyers do not need to call the API. |